Interactive Infographic
In 2019 we conducted a study with our client that researched financial hardships for young people in the United States, ages 15-36. We put together an entire report which uncovered many of the reasons for financial hardship and what led them to financial rock bottom.
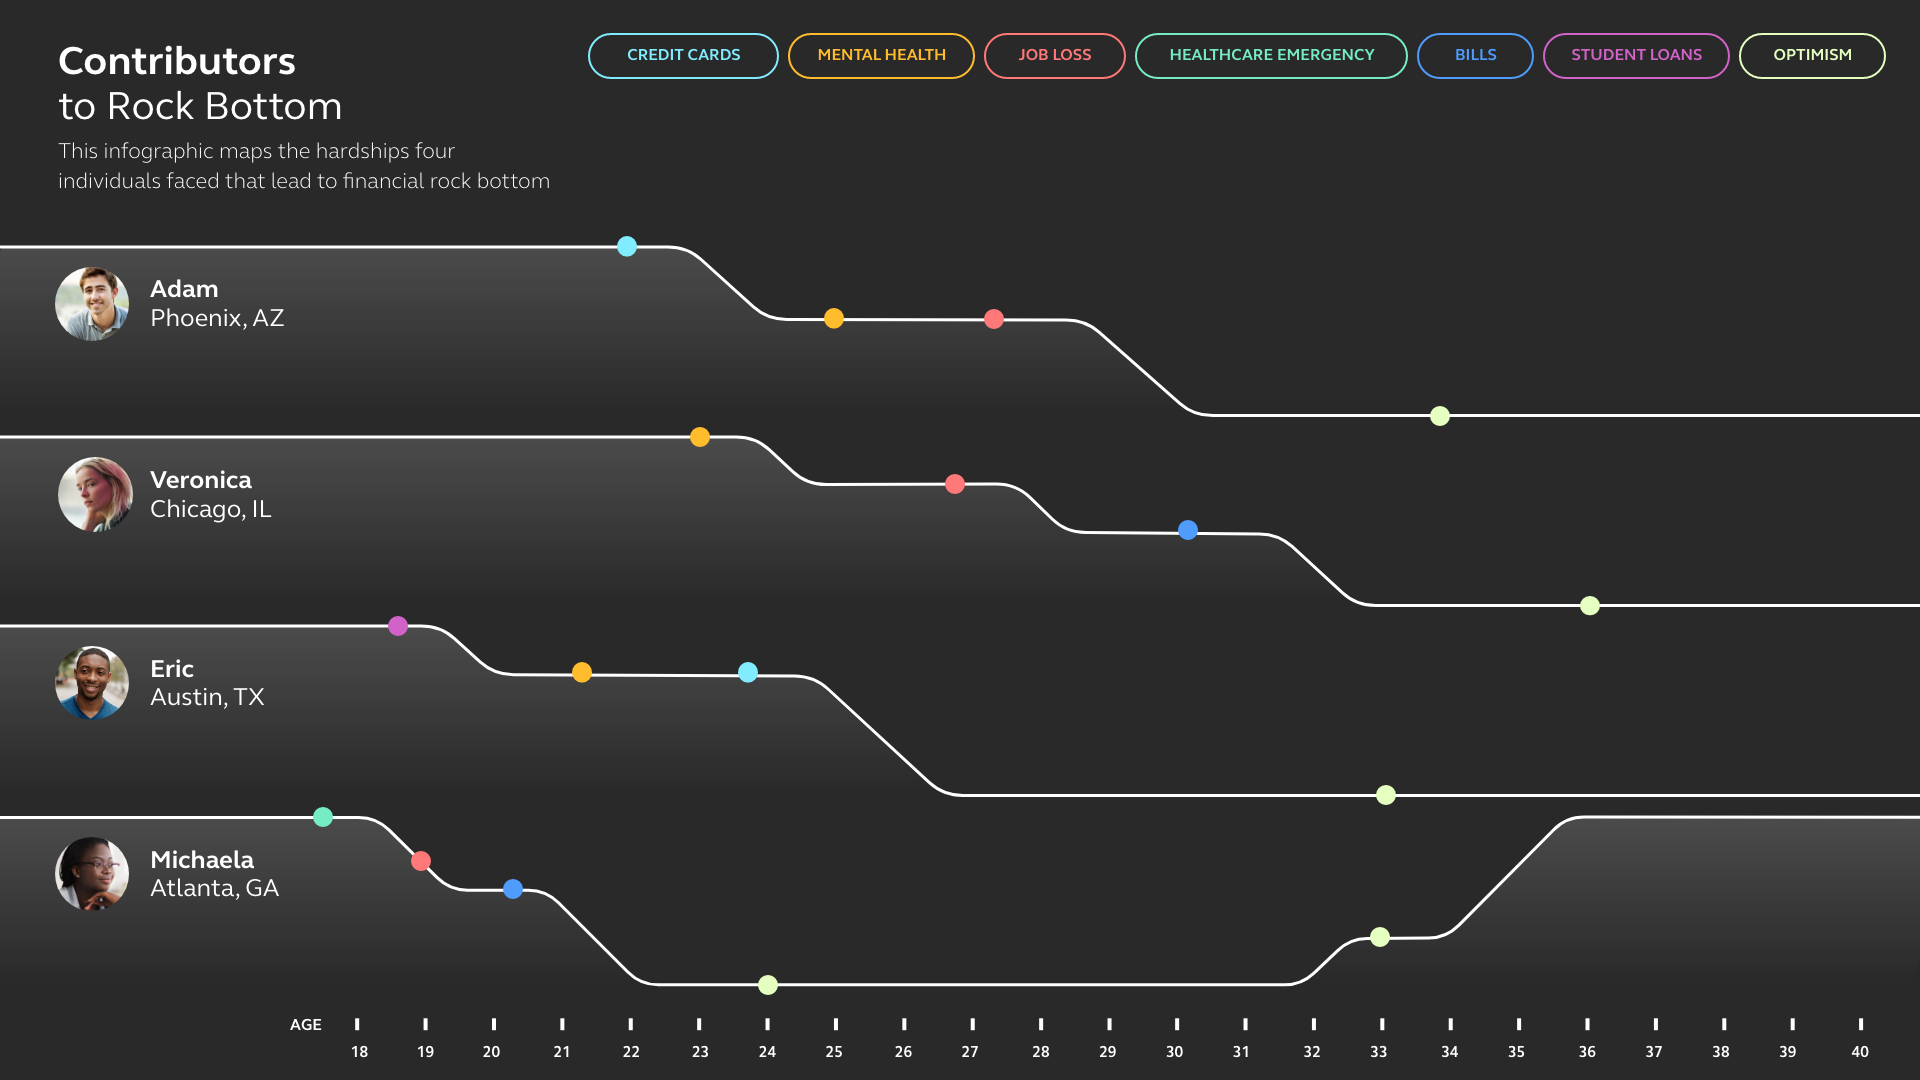
This study contained a lot of interesting information including case studies of individuals with their own personal stories of how they reached financial rock bottom. As you read through each individual’s story you realize that many of these individuals went through similar hardships and some people had other unique things happen to them. I thought it would be interesting to take this information and turn it into an interactive infographic.
I knew I wanted this infographic to be more than just a static one pager, but something that someone could interact with to gain information. Using my knowledge of the prototyping capabilities in Adobe XD I put together a timeline dashboard which categorizes the common financial hardships and when they happened to each individual.
Since there is a lot of information to share, the interactive element allows certain information to be hidden until clicked on which allows for a cleaner design.
(All of this information is based on the information and data from the report. But it has been changed for confidentiality.)
Lo-Fi Mock up
Screenshot of Adobe XD Prototype
Final Interactive Prototype
VITAL FINDINGS
Research - Research team at VF
Design Ideation + Prototyping - Sarah
Tools Used
Adobe XD


